| front |1 |2 |3 |4 |5 |6 |7 |8 |9 |10 |11 |12 |13 |14 |15 |16 |17 |18 |19 |20 |21 |22 |23 |24 |25 |26 |27 |review |
 |
As alluded to in
Slide 7, the major problems with hazard identification (HI) are the interpretation of
toxicity data and the concern on strength- or weight-of-evidence. For example, the toxic
effect in question could show up in a dog study, but not necessarily in a rat study. Does
this mean that the dog is more sensitive to the agent? Or that only the dog study was
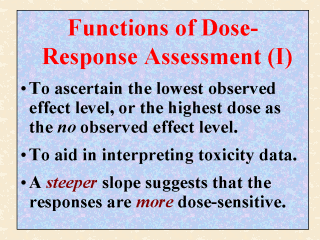
conducted effectively? The more important function of dose-response assessment is to ascertain the lowest dose that can be used as the LOEL (lowest observed effect level) or the highest dose as the NOEL (no observed effect level). There are often only 3 or 4 dose levels and few animals per level used in a toxicity study, primarily because this type of studies is very expensive to conduct. They usually cost $10,000 to $500,000 each (Klaassen and Eaton, 1991). Therefore, the LOEL or negative result (NOEL) is less appreciable if a dose-response curve cannot be constructed from all of the responses observed. For example, if the intermediate dose of a threesome yielded the highest response (i.e., that having most animals with the symptoms), the lower or negative response from the third, lowest dose could be construed as an artifact, or due to chance. On the other hand, if a dose-response curve could indeed be constructed showing a very steep slope, then the responses could be considered as very sensitive to dose level, suggesting that the NOEL may be very close to the LOEL. When the dose-response slope is less steep, the responses tend to be less dose-sensitive. |