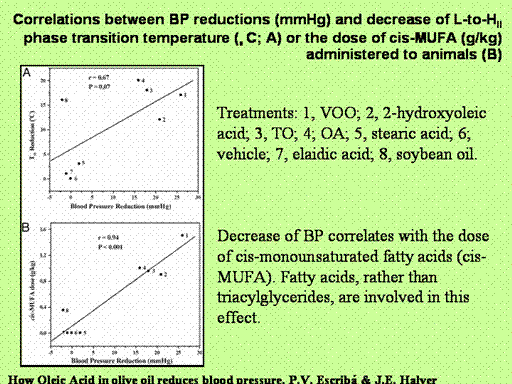
Correlations between BP reductions
(mmHg) and decrease of L-to-HII phase transition
temperature (°C; A) or the dose of cis-MUFA (g/kg)
administered to animals (B). Each
numbered point represents the treatment: treatment 1, VOO;
treatment 2, 2-hydroxyoleic acid; treatment 3, TO; treatment 4; OA;
treatment 5, stearic acid; treatment 6; vehicle; treatment 7, elaidic
acid; treatment 8, soybean oil. Solid lines represent the regression of
the correlations, whose correlation coefficients (r) and statistical
significance (P) are shown in both cases.
