| front |1 |2 |3 |4 |5 |6 |7 |8 |9 |10 |11 |12 |13 |14 |15 |16 |17 |18 |19 |20 |21 |22 |23 |24 |25 |26 |27 |28 |29 |30 |31 |32 |33 |34 |35|36 |37 |38 |39 |40 |41 |42 |43 |44 |45 |46 |47 |48 |49 |50 |51 |52 |53 |54 |55 |56 |57 |58 |review |
 |
Numerous
examples of the use of fine mapping strategies are available in the
cardiovascular field but I have chosen this one from inflammatory bowel
disease because it is from my colleague Gilles Thomas and it nicely
demonstrates the subsequent steps of sequencing and functional studies.
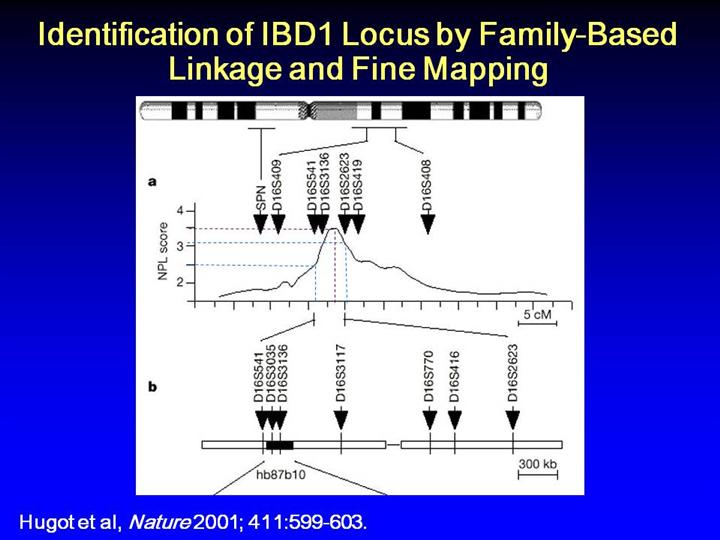
An
approximately 9-cm linkage peak localized the IBD1 locus to the
pericentromeric region of chromosome 1 with a maximum non-parametric LOD
score of 3.49, as shown in panel a. Fine mapping was concentrated on
the area between markers D16S541 and D16S2623. 26 additional
microsatellite markers were tested in this region, the location of 9 of
which are shown in panel B above.
The
third microsatellite from the left, D16S3136, was associated with the
disease in 108 trios at p < 0.05, and the association was replicated in
another 76 families at p < 0.01, though with a different allele.
This
difference in allelic associations at the same locus could be due to
chance or could reflect a true association in two sets of families drawn
from genetically distinct populations. This would suggest that D16S3136
is in linkage disequilibrium with the disease-causing variant, though
the microsatellites could have diverged after the disease-related
variant arose. Well come back to this example.
|