| front |1 |2 |3 |4 |5 |6 |7 |8 |9 |10 |11 |12 |13 |14 |15 |16 |17 |18 |19 |20 |21 |22 |23 |24 |review |
 |
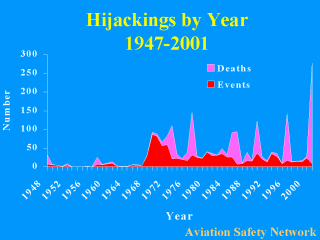
The number of
hijackings observed have varied over time. The peak period for hijackings occurred from
1968-1973. Dramatic screening measures where implemented at that time, and the frequency
of hijacking has been reduced, though not eliminated. On average, from 1972-2001, there
are about 22 events per year. Deaths from hijackings are particularly pronounced in the graph. Peaks are observed for the years 1973, 1977, 1985-86, 1990, 1996, and 2001. These deaths are primarily related to one major event happening in those years (2001 aside). There also appears to be a pattern to these major events, with one every five years or so. What factors may contribute to this observation? |