| front |1 |2 |3 |4 |5 |6 |7 |8 |9 |10 |11 |12 |13 |14 |15 |16 |17 |18 |19 |20 |21 |22 |23 |24 |25 |26 |27 |28 |29 |30 |31 |32 |33 |review |
 |
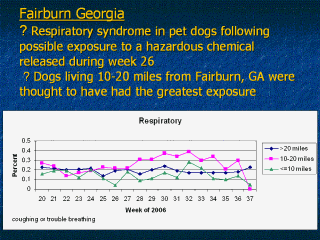
· This graph shows
that the frequency of respiratory signs increased for dogs living 10-20
miles from Fairburn, GA following the chemical release during week 26,
compared with the previous weeks. · Caution must be used in drawing conclusions about these findings since these represent the proportion of dogs with illness rather than the incidence. · Studies are ongoing including analyses to identify time-space clusters of specific clinical syndromes. |