| front |1 |2 |3 |4 |5 |6 |7 |8 |9 |10 |11 |12 |13 |14 |15 |16 |17 |18 |19 |20 |21 |22 |23 |review |
 |
The
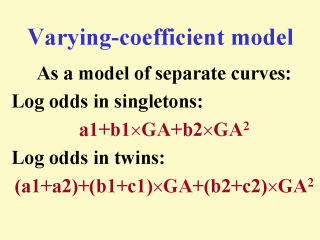
varying-coefficient model can also be seen as a model of separate mortality curves. That
is, a1+b1 x GA+b2 x GA2 represents the curves for singletons. The function [(a1+a2)+(b1+c1) x GA+(b2+c2) x GA2] represents the curve for twins. Note that when there are covariates in the regression model, the above curves represent mortality levels when all the other covariates take on values of zeros. The present purpose is to compare the mortality patterns of twins and singletons, not to identify the actual mortality levels from the two estimated curves. |