| front |1 |2 |3 |4 |5 |6 |7 |8 |9 |10 |11 |12 |13 |14 |15 |16 |17 |18 |19 |20 |21 |22 |23 |24 |25 |review |
 |
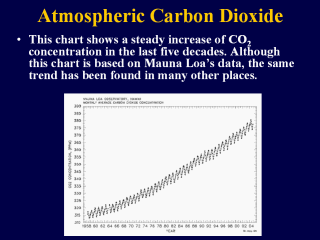
Charles Keeling had kept track of the
atmospheric concentration of CO2 since ’50s. This
chart shows a steady increase of CO2 concentration (in
addition to the annual fluctuation) in the last five decades. Although this
chart is based on Mauna Loa’s data, the same trend has been found in many
other places. |