| front |1 |2 |3 |4 |5 |6 |7 |8 |9 |10 |11 |12 |13 |14 |15 |review |
 |
Quality indicators
highlight areas with good quality care and those with potential problems.
They may also be used to provide physicians with individual feedback and
comparisons to their peers. Indicators can facilitate comparisons (among
physicians, over time, and against standards), promote accountability, and
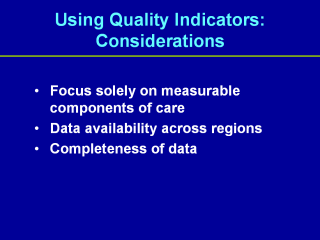
identify unacceptable levels of performance. They often focus solely on
measurable components of care. Other factors such as personal rapport and
demonstrated concern also contribute to quality, but are not easily
quantifiable. It is important to note that when used individually indicators
do not reflect the overall quality of care provided by a physician; a
composite measure could summarize quality across many indicators
simultaneously. Indicators that can be used to make comparisons between regions are determined by the available data. In Manitoba, for example, in order to include physicians outside Winnipeg, indicators were limited to those not requiring lab data, which are only available for Winnipeg. Physician data derive from billing claims, which have been shown to be reliable for services provided by fee-for-service physicians.7,8 Reliability of shadow billings by physicians paid by alternate plans, however, is not well-established. Under-billing by these physicians may make them appear to be providing poorer quality care than is the case. This is particularly true for rural area as most non-fee-for-service physicians practice outside of the larger urban areas in Manitoba. 7 Roos LL, Mustard CA, Nicol JP, McLerran DF, Malenka DJ, Young TK, Cohen MM. Registries and administrative data: Organization and accuracy. Medical Care 1993;31(3):201-12.8 Muhajarine N, Mustard C, Roos LL, Young TK, and Gelskey DE. Comparison of survey and physician claims data for detecting hypertension.” Journal of Clinical Epidemiology 1997;50(60):711-8. |