| front |1 |2 |3 |4 |5 |6 |7 |8 |9 |10 |11 |12 |13 |14 |15 |16 |17 |18 |19 |20 |21 |22 |23 |24 |25 |26 |27 |28 |29 |30 |31 |32 |33 |34 |35 |36 |review |
 |
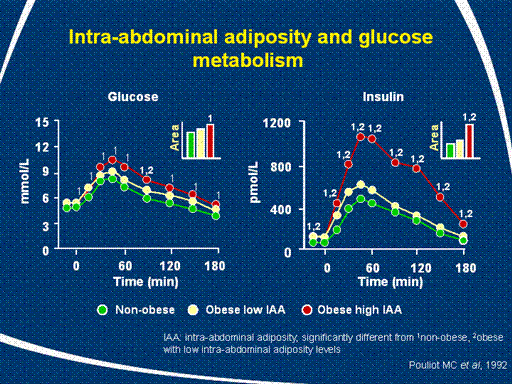
These data are from the study described in the previous
slide. Plasma glucose and insulin
concentrations during an oral glucose tolerance test (the inset
graphs show area under the plasma concentration-time curves) were broadly
similar in lean subjects and in obese subjects
with low intra-abdominal adiposity. The presence of obesity
per se therefore did not appear to
influence glycaemic status in these subjects.
In contrast, plasma glucose concentrations were
significantly higher in obese subjects with high
intra-abdominal adiposity, compared with the lean controls.
While glucose levels generally differed little between obese subjects
with high and low intra-abdominal adiposity, a markedly and
significantly greater hyperinsulinaemia was required to maintain these
glucose levels in the obese/high intra-abdominal adiposity group.
These results show that intra-abdominal adiposity is a
more important cause of insulin
resistance than obesity
per se.
|