| front |1 |2 |3 |4 |5 |6 |7 |8 |9 |10 |11 |12 |13 |14 |15 |16 |17 |18 |19 |20 |21 |22 |23 |24 |25 |review |
 |
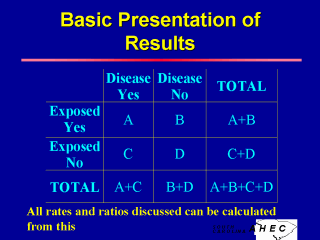
Chi-square is the basic statistic used to test for the significance of any differences noted in distribution of disease or risk in a table such as this. A= the number of individuals who are exposed and have the disease B= the number of individuals who are exposed and do not have the disease C= the number of individuals who are not exposed and have the disease D= the number of individuals who are both non-exposed and non-diseased A+B+C+D= the total number of individuals in the population being studied A+B= the total number of individuals exposed C+D= the total number of individuals non-exposed A+C= the total number of individuals with the disease B+D= the total number of individuals without the disease Any rates needed for epidemiologic analysis can be calculated from this basic table. Unless your students are extremely familiar with statistics, you should insert an example that will be of interest, and take some time to discuss it. |
| front |1 |2 |3 |4 |5 |6 |7 |8 |9 |10 |11 |12 |13 |14 |15 |16 |17 |18 |19 |20 |21 |22 |23 |24 |25 |review |