| front |1 |2 |3 |4 |5 |6 |7 |8 |9 |10 |11 |12 |13 |14 |15 |16 |17 |18 |19 |20 |21 |22 |23 |24 |25 |26 |27 |28 |review |
 |
This slide
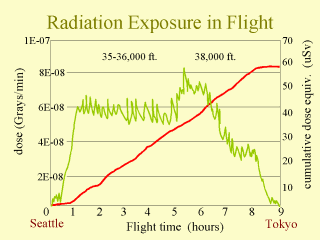
provides an illustration of the variance in cosmic radiation associated with air travel.
The graph notes the absorbed dose of radiation at different points in time on a flight
from Seattle to Tokyo on board a 747-200 aircraft. The solid red line (increasing) notes
the cumulative dose during the time of the flight. At the start of the flight, there are extremely small levels of absorbed dose. This reflects the plane on the ground in Seattle. Note the sharp increase as the plane rises to flight altitude quite quickly after takeoff (within 30 minutes). Later in the flight an other increase in absorbed dose (green line) is observed. This likely reflects the plane travelling over the polar regions on the trip to Tokyo, as well as higher altitude levels. The descent into Tokyo appears measured. In Waters M, Bloom TF, Grajewski B. The NIOSH/FAA Working Women’s Health Study: Evaluation of the Cosmic Radiation Exposures of Flight Attendants Health Physics 79(5):553-559, November 2000 |