| front |1 |2 |3 |4 |5 |6 |7 |8 |9 |10 |11 |12 |13 |14 |15 |16 |17 |18 |19 |20 |21 |22 |23 |24 |25 |26 |27 |28 |29 |30 |review |
 |
Distributions
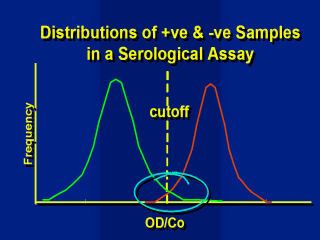
of samples around The cutoff value in an Immunoassay: In practice the negative and positive distributions of samples will be around the cutoff but with overlap at the cutoff area. This area denotes the false reactivity of the assay. To evaluate the assay correctly the distributions of the sample O.D. to cutoff values for both negative and positive sample populations should be defined. This will require adequate numbers of samples over the whole distribution of negative and positive reactivity ranges. To define these populations, samples should not be selected that will introduce any bias into the normal positive and negative population distributions. Such bias will exaggerate the degree of false reactivity. However, the potential of the reactivity in the areas of false reactivity should be defined by using "problem" samples or samples that are likely to react in the assays; for example, samples with high IgM levels. |