| front |1 |2 |3 |4 |5 |6 |7 |8 |9 |10 |11 |12 |13 |14 |15 |16 |17 |18 |19 |20 |21 |22 |23 |24 |25 |26 |27 |28 |29 |30 |31 |32 |33 |34 |35 |36 |37 |38 |39 |40 |41 |42 |43 |44 |45 |46 |47 |48 |49 |50 |51 |52 |53| 54 |review |
 |
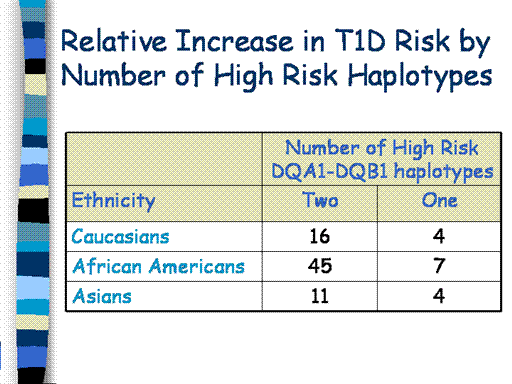
This table
illustrates the relative increase in T1D risk (i.e., relative to someone
with no high risk haplotypes) according on the number of high risk
DQA1-DQB1 haplotypes an individual carries.
Caucasians with two high risk haplotypes have a 16-fold higher
T1D risk than an individual who has no high risk haplotypes.
And the risk for Caucasian individuals with one high risk
haplotype is about 4 times higher that the risk for someone with no high
risk haplotypes. This also means
that Caucasians with two high risk haplotypes are 4 times more likely to
develop T1D than those with one high risk haplotype. And individuals
with one high risk haplotype are about 4 times more likely to develop
T1D than those with no high risk haplotypes.
As
illustrated, the magnitude of the relative increase in risk differs by
ethnicity. However, the same
trends are apparent – individuals with two high risk haplotypes are most
likely to develop T1D. This
likely indicates that the frequency other genes and / or environmental
factors that influence T1D risk varies across ethnic groups.
It also indicates that it is important to consider ethnicity when
calculating and interpreting genetic test results.
|