| front |1 |2 |3 |4 |5 |6 |7 |8 |9 |10 |11 |12 |13 |14 |15 |16 |17 |18 |19 |20 |21 |22 |23 |24 |25 |26 |27 |28 |29 |30 |31 |review |
 |
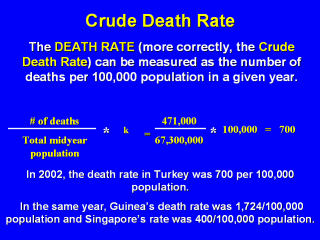
Where the population serves as the denominator for annualized mortality or morbidity rates, the midyear population serves as the best approximation of the population-at-risk for the event represented in the rate numerator, such as death by any cause. This makes allowance for changes in population due to births, deaths, or migration that occur over the year for which the measurement applies. |