| front |1 |2 |3 |4 |5 |6 |7 |8 |9 |10 |11 |12 |13 |14 |15 |16 |17 |18 |19 |20 |21 |22 |23 |24 |25 |26 |27 |28 |29 |30 |31 |32 |33 |34 |35 |36 |37 |38 |39 |40 |41 |42 |43 |44 |45 |46 |47 |48 |49 |50 |51 |52 |53 |54 |55 |56 |57 |58 |review |
 |
On the date of survey, the
earthquake-stricken area of Bam was divided to 13 zones. The samples
were
proportionally distributed in 8 zones, based on
a rough estimate of the total number of tents.
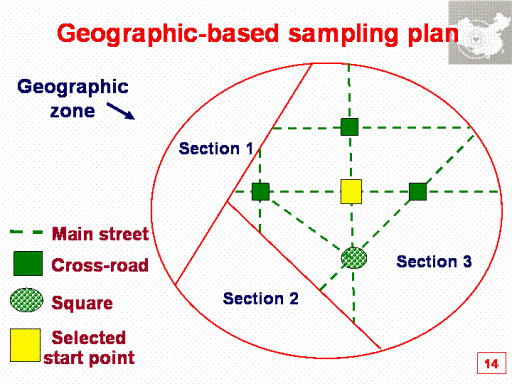
To determine the clusters, with the
help of an available map and a native who was well familiar with the
city, each zone was divided to some sections by
half of required clusters. In each section, the main squares and
cross-roads were determined and one of them was selected randomly.
|