| front |1 |2 |3 |4 |5 |6 |7 |8 |9 |10 |11 |12 |13 |14 |15 |16 |17 |18 |19 |20 |21 |22 |23 |24 |25 |review |
 |
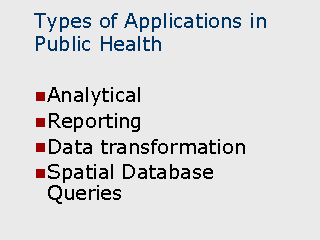
Analysis Analytical applications are ones in which a GIS is used as a spatial data visualization tool. Examples of analytical applications would be to identify the location of a target population based on the socio-economic characteristics of individuals residing in a given community. Another analytical application would be the use of a GIS to identify a disease cluster and then to describe it’s characteristics in terms of nearby health resources, risk factors, etc. Reporting The reporting capabilities of GIS systems allow users to create tabular reports based on the data underlying geographic layers. In a basic example, all of the geographic features in a layer could be simply listed together with key attributes. In a more complex example, the result of an analytical process could be used to generate a report. For example, a report could contain all of the geographic regions (such as census tracts) that contain more than a given number of geocoded points. In another example, all of the features that are within a given proximity of one or more point locations could be identified and reported. Transformation Data transformation applications rely on the use of a GIS to transform a dataset or append variables to a dataset based on the spatial characteristics of records. For example, appending the distance that each case resides from the location of a known risk factor. In another example, one layer in a GIS may contain the boundaries of health districts, while another layer contains the residential point locations of individuals who visited a county clinic. By overlaying the two layers together, it is possible to append the respective health district identifier to each of the individual records in the database, solely on the basis of where they are physically located on the map. |