 |
R is a great software
environment for graphing data. R base comes with its own set of graphing
capabilities, in addition, you can also use libraries like lattice to draw
high quality graphs. The simplest functions are plot, and learn more about
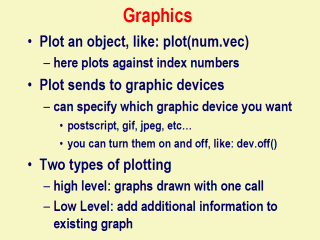
plotting by using ?plot in an R session. In general, there are two different
types of plotting – high level plotting, where graphs can be drawn with just
one call (e.g. plot), or low level plotting, where additional lines or
points can be drawn on the existing graph (for example point() function,
that helps to draw lines/points on an existing graph). You can add legends
to an existing graph by using the function legend(). For more information
about how to draw legends, type ?legend at the command prompt. You can also
save graphs to a variety of format for further actions. You can save the
graphs as jpg, png, or gif formats, using jpeg(), png(), or gif() functions.
After calling the plotting devices, you must turn them off by using dev.off()
function. Use ?jpeg, or ?png to learn more about them. |
