| front |1 |2 |3 |4 |5 |6 |7 |8 |9 |10 |11 |12 |13 |14 |15 |16 |17 |18 |19 |20 |21 |22 |23 |24 |25 |26 |27 |28 |29 |30 |31 |32 |33 |review |
 |
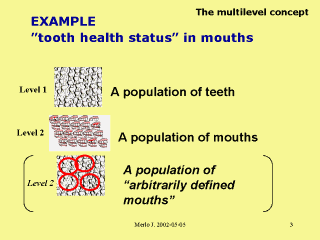
Suppose we analyze as level 1 variable ”tooth health
status”. ”Tooth health status” is an aggregation of several tooth characteristics (this variable follows a normal distribution, it has a mean and standard deviation) .There is a structure in this data, a hierarchy. We have TEETH as level 1 and MOUTHS as level 2. We also create “arbitrarily defined mouths” (red circles). These mouths are only a mix of teeth without any natural or anatomical criterion. |