| front |1 |2 |3 |4 |5 |6 |7 |8 |9 |10 |11 |12 |13 |14 |15 |16 |17 |18 |19 |20 |21 |22 |23 |24 |25 |26 |27 |28 |29 |30 |31 |32 |33 |34 |35 |review |
 |
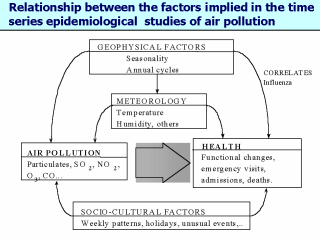
Time series studies One of the most used epidemiological design type is the ecological time series studies. In them, the variations in time of exposure and the health indicator of a certain population are analysed (number of deaths, hospital admissions, etc..). One advantage of these studies is that when analysing the same population in different periods of time (day to day, generally) many of the variables which could act as confounding factors at individual level (smoking habit, age, gender, profession/occupation, etc.) are maintained stable within the same population and loose their confounding potential (Schwartz et al., 1996). In these studies possible confounding factors are those which can covariate with health indicators and pollutants along time. These factors can be summarised in four groups: geophysical, meteorological, socio-cultural (for instance, the weekly activity pattern) and correlated illnesses such as influenza with a clear seasonal behaviour (Goldsmith et al., 1996) (Figure). The construction of any mathematical model analysing the relationship between air pollution and health must take into account these factors. |