| front |1 |2 |3 |4 |5 |6 |7 |8 |9 |10 |11 |12 |13 |14 |15 |16 |17 |18 |19 |20 |21 |22 |23 |24 |25 |26 |27 |28 |29 |30 |31 |32 |33 |34 |35 |review |
 |
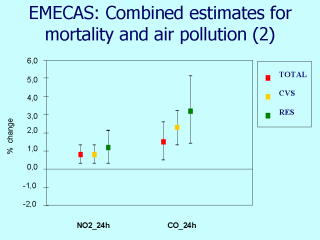
NOTE: Results
expressed as the estimated percentage changes in daily deaths (and the 95%CI) for an
increase of 10 µg/m3 (1mg/m3 for CO) in the concentration of the pollutant levels. Lag
01. Single pollutant models NO2 and CO also showed this pattern with higher estimates for specific causes, for NO2 we found an association of 0.6, 0.8 and 1.2 % increase in total, cardiovascular and respiratory causes, respectively. An increase on 1mg/m3 of CO was associated with a 1.5, 2.3 and 3.2 % in total, cardiovascular and respiratory causes, respectively. Ozone only showed statistical significance with cardiovascular mortality (Saez, et al). When two pollutant analyses were performed, estimates for all pollutants did not substantially modify, except for SO2 where estimates for daily levels were strongly attenuated. On the contrary, the association for one-hour maximum levels of this pollutant did not show any change. |