|
|
|
|
front |1 |2 |3 |4 |5 |6 |7 |8 |9 |10 |11 |12 |13 |14 |15 |16 |17 |18 |19 |20 |21 |22 |23 |24 |25 |26 |27 |review |
 |
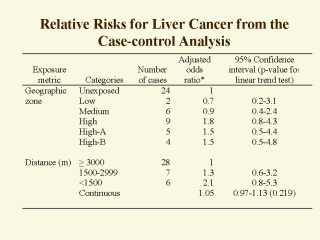
This table shows an analysis according to distance from the perimeter of the site to each subjectís residence at time of diagnosis. Relative risks increase with proximity, but the numbers are small. An analysis using distance as a linear continuous variable suggests a monotonic relationship. |