| front |1 |2 |3 |4 |5 |6 |7 |8 |9 |10 |11 |12 |13 |14 |15 |16 |17 |18 |19 |20 |21 |review |
 |
As we saw on the
previous slide, the two-part question from the 1988 CHS yielded lower
estimates than the standard single question from the 1988 NHIS. This is
expected because, as mentioned earlier, the two-part question yields a more
specific case definition. Because the two-part question in the redesigned
NHIS from 1997 onward is similar to the 1988 CHS question, we can inflate
the estimates from the redesigned NHIS by a factor that reflects the
difference between the 1988 CHS and standard NHIS question. The inflated
estimates are a crude approximation of what the estimates from 1997 onward
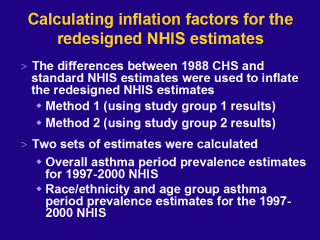
might have been if the NHIS had not been redesigned. We inflated the 1997-2000 NHIS asthma attack prevalence estimates using two methods. The first method used the difference between the 1988 CHS and standard NHIS for study group 1 (seen in the top row in the left-hand column on the previous slide). The second method used the 1988 CHS and standard NHIS difference for study group 2. We used both these methods first on the overall estimates and then on the estimates for age and race/ethnicity subgroups. Because some of the subgroup estimates are based on small numbers, we will not show the results for the individual groups. Rather, we weighted the subgroup estimates to come up with an alternative overall estimate. The results are shown on the next slide |