| front |1 |2 |3 |4 |5 |6 |7 |8 |9 |10 |11 |12 |13 |14 |15 |16 |17 |18 |19 |20 |21 |22 |23 |24 |25 |26 |27 |28 |29 |30 |31 |32 |33 |34 |35 |review |
 |
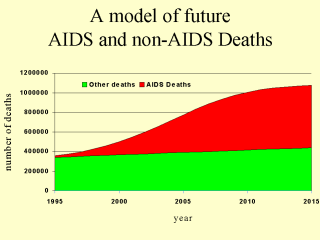
The above graph
represents the Metropolitan Life projections made about future AIDS and non-AIDS deaths. Deaths due to non-AIDS are predicted to remain relatively constant, however deaths due to AIDS are predicted to rise steadily and rapidly between 2000 and 2015. By 2015 over half of all deaths will be AIDS-related. Models such as this are important as they provide planners and policy makers with some indications of possible future circumstances. These models also provide statistics for phenomenon not usually measured because of a lack of data. For further information on AIDS related adult mortality in South Africa see the Medical Research Council’s “The impact of HIV/AIDS on adult mortality in South Africa”, available at www.mrc.ac.za/bod/ |