 |
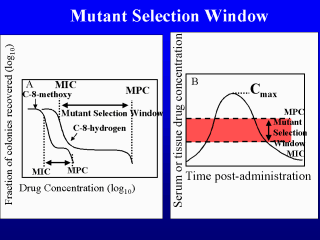
In panel A a cartoon of the
selection window is sketched using the data shown in slide 12. The point is that resistant
mutants are selectively enriched when drug concentrations fall inside the window. I In
panel B the same data are placed on a stylized version of a pharmacokinetic plot in which
drug is given to volunteers at time zero and then serum concentrations are measured at
various times. MIC and MPC define the boundaries of the mutant selection window. This
depiction of the window provides a straightforward explanation for the development of de
novo resistance. Drug concentrations are commonly placed above MIC to have an effect
on pathogen growth. At the same time, drug costs and toxic side effects tend to keep the
drug concentrations low. The net result is that antimicrobials are often dosed such that
their concentrations fall inside the mutant selection window. That makes mutant enrichment
an inevitable consequence of dosing-to-cure strategies. |
