| front |1 |2 |3 |4 |5 |6 |7 |8 |9 |10 |11 |12 |13 |14 |15 |16 |17 |18 |19 |20 |review |
 |
Analysis.
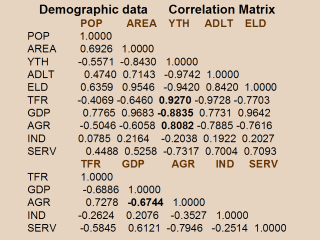
The correlation matrix Y axis reads: population,
area, youth 0-15, adults 15-65, elderly over 65 years, total fertility rate
(TFR), gross domestic product per capita (GDP), then % workers in
agriculture, industry & services. High income & longevity have r = 0.9642.
The logic in these linear correlations is of course selfevident. However,
USA & Canada are quite out of place. The foremost fact is that high birth rate is usually associated with a youthful population. Next this youthful population is associated will POVERTY. Nothing can be seen more clearly. Then follow with family planning and health care. Read on fertility transition at http://www.pitt.edu/~super1/lecture/lec13311/001.htm |