| front |1 |2 |3 |4 |5 |6 |7 |8 |9 |10 |11 |12 |13 |14 |15 |16 |17 |18 |19 |20 |review |
 |
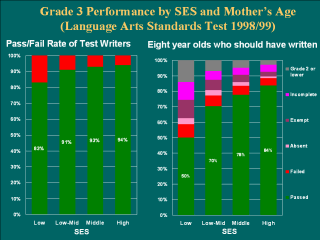
LEGEND
Green = Passed
Purple = IncompleteMaroon = Exempt
Pin k= Absent
Red = Failed Grey = Grade 2 or lower
When do children from lower socioeconomic backgrounds start
falling behind? To try to
answer this
question, we’ve focused on performance on the Grade 3 standards
tests. By Grade 3, children
from low-SES neighbourhoods were already much less likely to be
performing well – that is, passing the Grade 3 standards test at an
age-appropriate time. Looking
only at the performance of those who wrote the test, the differences
across socioeconomic groups do not seem very large (graph on
left-hand side).
Once again, this does not tell the whole story.
To see the complete picture we identified all children born
in
Manitoba in 1990 and living in Winnipeg in the 1998-99 school year
who should have been writing the grade 3 standards test that
year (graph on right-hand side).
Only 50% of those living in low-SES neighbourhoods passed the
test on schedule, compared to 84% of those living in Winnipeg’s
high-SES neighbourhoods.
Additionally, almost 15% of students living in low-SES
neighbourhoods were enrolled in Grade 2 or lower and, compared to
other neighbourhoods, more failed the test, did not complete it,
were exempt from it or were absent on the day when it was written.
|