| front |1 |2 |3 |4 |5 |6 |7 |8 |9 |10 |11 |12 |13 |14 |15 |16 |17 |18 |19 |20 |21 |22 |23 |24 |25 |26 |27 |28 |29 |30 |31 |32 |33 |34 |35 |36 |37 |38 |review |
 |
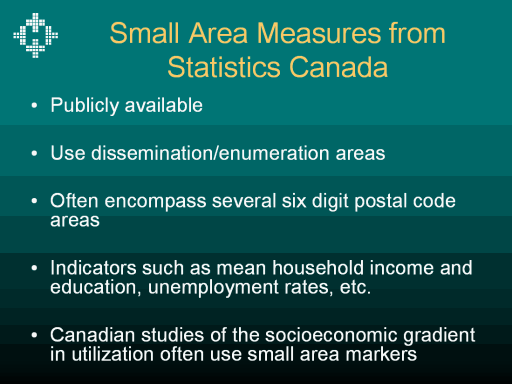
Statistics Canada data provide
additional information and assist in “breaking” down population data
into smaller areas which can be characterized along a number of
dimensions.
Linked subsamples of survey and
administrative data have been used to correlate individual
household income and mean small area income.
The correlations were .57 for urban Winnipeg and .30 for
outside Winnipeg (mostly rural areas).
|