| front |1 |2 |3 |4 |5 |6 |7 |8 |9 |10 |11 |12 |13 |14 |15 |16 |17 |18 |19 |20 |21 |22 |23 |24 |review |
 |
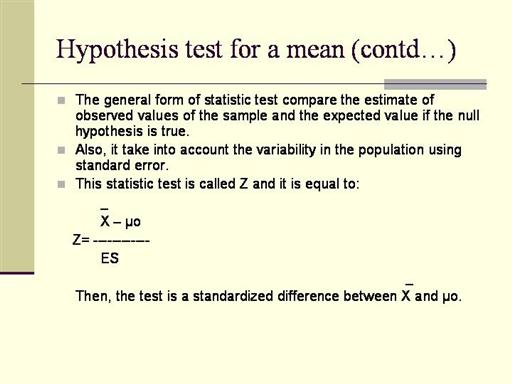
If the null hypothesis is true all results
of this test that can be obtain from different samples taken of the same
population should have a μo and have a distribution as the standard
Normal distribution.
This is due that the mean of the sample,
should be distributed Normally with mean (μo) and standard deviation,
(ES).
Thus, using the tables for two tails from
the standard Normal distribution, we can obtain the probability value
for the observed Z test. This is know as p value.
P value is the area under the curve that
correspond to values out of the range (-z, z). The area in the tails of
distribution give the probability of observe values more extremes.
If the p value is big, we can say that the
option to observe a value as extreme as the sample value, should be high
if the null hypothesis is true. In this situation variability of
sampling can be the reason for the difference between the sample means
and the hypothesis mean, μo.
We cannot reject the null hypothesis and we
conclude that the sample mean is not significantly different from μo.
If the p value is little, we say that the
option of observe an as extreme value as the sample value should be
little if the null hypothesis is true. In this situation, the
variability of sampling is not probable that it can be the reason of the
difference between the sample mean and hypothesis mean, μo.
If the 95% confidence interval include the
mean of hypothesis, is probable that the mean of population of students
from FEOC is the same that the mean of students from FCA.
|