| front |1 |2 |3 |4 |5 |6 |7 |8 |9 |10 |11 |12 |13 |14 |15 |16 |17 |18 |19 |20 |21 |22 |23 |24 |25 |26 |27 |28 |29 |30 |31 |32 |33 |34 |35 |36 |37 |38 |review |
 |
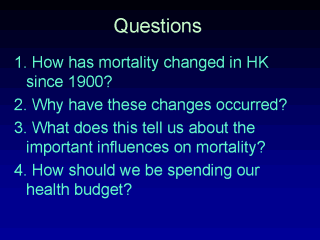
The data presented
so far in this lecture lead us to ask a number of questions: 1. In what ways has mortality changed in HK since 1900?; 2. What has been responsible for these changes? 3. What can we deduce about the influences on mortality that are most significant? 4. Based on these data, how should we spend our budget to maximize the health gain for the community? The next few slides look at each of these questions in turn: |