| front |1 |2 |3 |4 |5 |6 |7 |8 |9 |10 |11 |12 |13 |14 |15 |16 |review |
 |
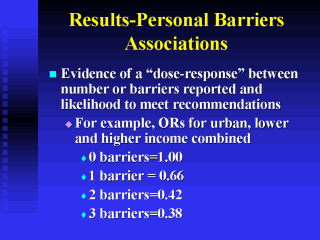
There was also evidence of a
dose response between number of personal barriers reported and meeting of PA
recommendations across all groups. This relationship was more easily illustrated when income groups were combined. Here are the ORís for urban residents those reporting 1 barrier like (being afraid of injury or not having child care) were 34% less likely to meet recommendations for PA; those reporting 2 barriers were 58% less likely to meet recommendations; those reporting 3 barriers were 62% less likely to meet recs. |