| front |1 |2 |3 |4 |5 |6 |7 |8 |9 |10 |11 |12 |13 |14 |15 |16 |17 |18 |19 |20 |21 |22 |23 |24 |25 |26 |27 |28 |29 |30 |31 |32 |33 |review |
 |
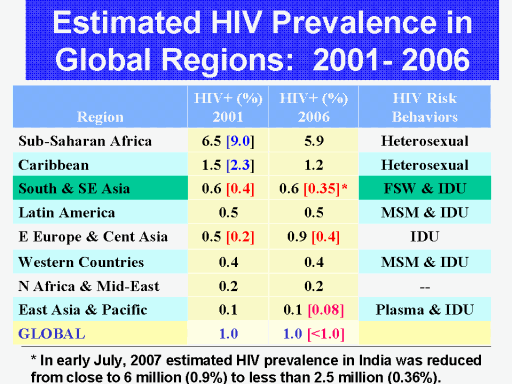
This table provides a summary of the estimated HIV
prevalence and trends in major global regions since the new
millennium. All of
the regional estimates are based on UNAIDS reports.
Estimates (blue numbers) within the black brackets
[xx] are the initial UNAIDS estimates – i.e., in the 2001
update report, UNAIDS estimated HIV prevalence in SSA at 9%
and then revised its 2001 estimate downwards to 6.5% in the
2003 update report. Estimates (red numbers) within the red
brackets [xx] are my “unofficial” estimates – i.e., I
believed that HIV prevalence was grossly overestimated in SE
Asia (at least a couple of million overestimated in India
alone) and in Eastern Europe.
UNAIDS was forced to accept a revised estimate of 2.5
million for India in early July, 2007. The take home message
is that even using UNAIDS’ official estimates, the AIDS
pandemic is not “ever increasing and expanding.” The only
region where estimated HIV prevalence seems to be increasing
is Eastern Europe but my biased view is that perhaps HIV
prevalence may be increasing in this region, but the
estimates for this region are also grossly overestimated!
|