| front |1 |2 |3 |4 |5 |6 |7 |8 |9 |10 |11 |12 |13 |14 |15 |16 |17 |18 |19 |20 |21 |22 |23 |24 |25 |26 |27 |28 |29 |30 |31 |32 |33 |review |
 |
UNAIDS
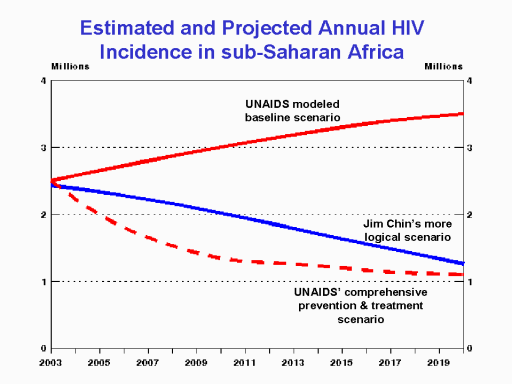
in its December 2005 report on the global AIDS epidemic presented
the modeled impact of different prevention and treatment programs in
reducing annual HIV incidence in SSA.[1] The HIV scenario selected
by these modelers as the “baseline” for comparing future HIV
incidence assumed that risk behaviors continued at
what the modelers believed to be the current levels, and without any
major increase in anti-retroviral treatment (ART) programs.
Based on their assumptions, the modelers
projected a level and unchanging (“stable”) prevalence rate in SSA
over the duration of the projection – 20 years.
These modelers
completely ignored the major factor responsible for peaking in all
infectious disease epidemics – the phenomena of saturation of infection in
persons who are at risk of infection.
Thus, unless HIV risk behaviors begin to increase, HIV incidence will slowly
decrease after reaching a peak. How
much of the future decrease in annual HIV incidence might be attributed to
public health prevention programs and how much to a natural decrease can and
will definitely be the subject for heated debate for the rest of this
decade! Models that project
unrealistic increases in HIV incidence will just serve to exaggerate the
effectiveness of current prevention programs!
[1] Salomon JA,
Hogan DR, Stover J, et al (2005) Integrating HIV prevention and
treatment: From slogans to impact.
PLoS Med. 2(1): e16.
[January 11, 2005].
|