| front |1 |2 |3 |4 |5 |6 |7 |8 |9 |10 |11 |12 |13 |14 |15 |16 |17 |18 |19 |20 |21 |22 |23 |24 |25 |26 |27 |28 |29 |30 |31 |32 |33 |34 |35 |36 |37 |review |
 |
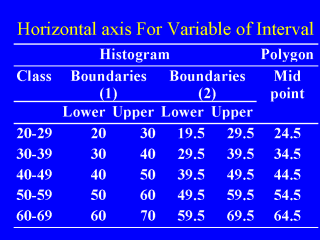
Before drawing a chart for the variable of interval the class boundaries should be decided. A histogram could be drawn either with the class boundaries (Boundaries 1) or mid way between the upper and lower class boundaries (Boundaries 2). For a frequency polygon the horizontal axis represents the mid point of each class interval |