| front |1 |2 |3 |4 |5 |6 |7 |8 |9 |10 |11 |12 |13 |14 |15 |16 |17 |18 |review |
 |
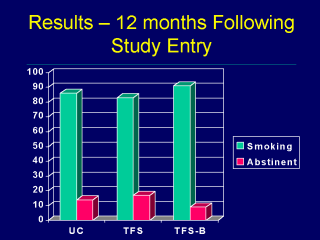
This bar graph represents the percentage of subjects in each group who self-reported smoking or abstinence following the delivery of the 8 week intervention. There were no statistically significant differences between smoking behavior and treatment groups. |