| front |1 |2 |3 |4 |5 |6 |7 |8 |9 |10 |11 |12 |13 |14 |15 |16 |17 |18 |19 |20 |21 |22 |23 |24 |25 |26 |27 |28 |review |
 |
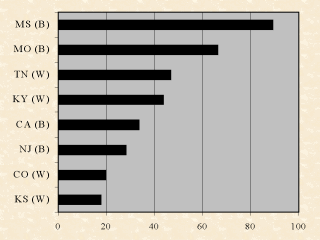
CHD mortality
(ICD 410-414, 429.2) among black and white men aged 35-44 in the US in 1994. (The highest and lowest two states by race.) The highest and the lowest two states in both black and white are displayed. There is a 5-fold difference in CHD mortality among men aged 35-44 by state and race in the United States. Mortality rate (/100,000) B: Black, W: White |