| front |1 |2 |3 |4 |5 |6 |7 |8 |9 |10 |11 |12 |13 |14 |15 |16 |17 |18 |19 |20 |21 |22 |23 |review |
 |
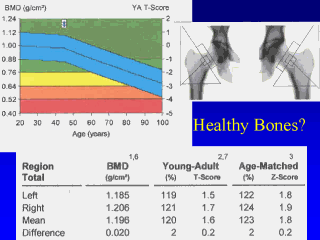
This slide depicts the results of a hip DXA scan on a 45 year old woman. To interpret this DXA scan, compare the subject’s T score to the cutpoints in the previous slide. The Z score compares her scan data to what would be expected in her age group. Yes, she has “healthy” hips. |