| front |1 |2 |3 |4 |5 |6 |7 |8 |9 |10 |11 |12 |13 |14 |15 |16 |17 |18 |19 |20 |21 |22 |23 |24 |25 |review |
 |
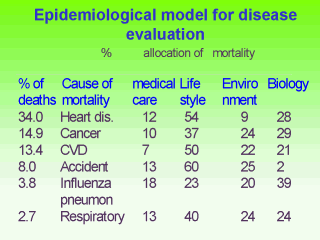
This table outlines
some interesting data. The first column on the left gives the proportion of deaths
attributable to the six top causes of mortality in the USA in 1973, listed in the second
column (Heart dis. =all heart disease; CVD, cerebro-vascular disease; pneumon = pneumonia;
Respiratory= all other respiratory diseases). The third to sixth columns list the
proportional contribution to the disease estimated to arise from each of the four columns
of: 1. medical care (how much medical care does to prevent mortality from the particular
diseases in column two), 2. lifestyle, 3. environmental and 4.biological contributions.
These proportions are derived from epidemiological studies which What can you conclude about the predominant sources of cause or prevention of these conditions? If we look at the fourth most important cause of death in the Usa in 1973, accidents, we see that about 85% of the variance in accident rates arises from life style and environmental factors, with biology being largely irrelevant as a contributor (2%) and subsequent medical care accounting for little more than one sixth (13%) of the variation in mortality from accidents. Other causes, like cancer,have a larger estimated contribution from biology, but less from treatment. |