 |
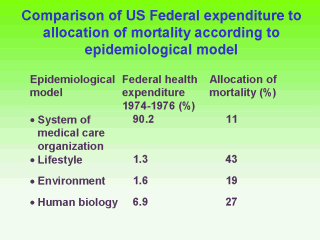
Compare this table with
the previous one. This table details the expenditure in the USA in 1974-6 on the four
different areas or components listed in the previous table (medical care, lifestyle,
environment and biology). The right hand column lists the total estimated contribution to
overall mortality from each of the four areas. The middle column gives the proportion of
government expenditure allocated to each of these four areas in 1974-1976. While these
data are getting a little dated now, they do indicate one thing quite clearly when you
consider this table with the data in the previous table. Can you say what this is? |
