| front |1 |2 |3 |4 |5 |6 |7 |8 |9 |10 |11 |12 |13 |14 |15 |16 |17 |18 |19 |20 |21 |22 |23 |24 |25 |26 |27 |28 |29 |30 |31 |32 |33 |34 |35 |36 |37 |38 |39 |40 |41 |review |
 |
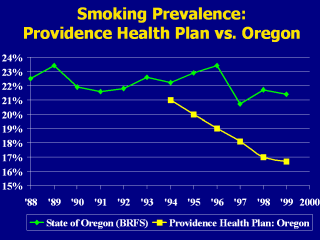
Information on smoking Prevalence from the
Behavioral Risk Factor Survey collected by Oregon Health Division Assume smoking rates in PHS were similar to smoking rates before we started measuring, but in 1994 smoking rates were equal. Systematic efforts started in 1995, our efforts have shown a real difference Numbers in 1998: Oregon: PHS: SET UP NEXT SLIDE: So far, our efforts have been successful, but interventions have been focused on MACRO level of health system. Next step that we needed to take was to focus on where the majority of health care takes place (IN THE CLINIC) We need to help busy clinicians improve efforts in the clinic HEATH PLAN MODEL AFFECTS HOW THIS HAPPENS |