| front |1 |2 |3 |4 |5 |6 |7 |8 |9 |10 |11 |12 |13 |14 |15 |16 |17 |18 |19 |20 |21 |22 |23 |24 |25 |26 |27 |28 |29 |30 |31 |review |
 |
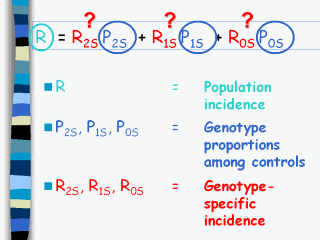
Therefore, we can use the
following equation to describe the relationship between the overall
T1D incidence in the population, and the 3 genotpye-specific risks,
which are weighted by the genotype proportions among the controls.
According to the above formula, we know R, P2S,
P1S and
P0S.
We need to determine the genotype-specific risks R2S,
R1S and
R0S.
|