| front |1 |2 |3 |4 |5 |6 |7 |8 |9 |10 |11 |12 |13 |14 |15 |16 |17 |18 |review |
 |
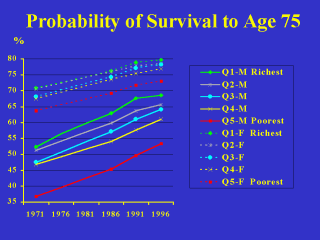
This slide shows
the percentage of each quintile expected to survive to age 75. The gradients by income
were similar in 1996 compared to 1971. Over the entire period, inter-quintile differences for males were over twice as large as those for females. Improvements were spread nearly evenly across the quintiles--so the inter-quintile differences persisted at approximately the same magnitude over the 25 years. |