| front |1 |2 |3 |4 |5 |6 |7 |8 |9 |10 |11 |12 |13 |14 |15 |16 |17 |18 |review |
 |
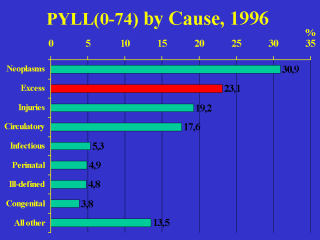
A useful way of
quantifying the impact of premature death by various causes is to calculate potential
years of life lost (PYLL) due to deaths prior to age 75. This slide shows total PYLL by the major causes of death in 1996. The lighter bars represent the percentage of total PYLL attributable to causes of death grouped according to the chapters of the International Classification of Diseases. The most important causes were neoplasms (cancer), with about 31% of the total, followed by injuries (intentional and unintentional) and circulatory diseases, each with a little less than 20% of the total. The dark bar represents the percentage of total PYLL that could be considered "excess" related to income differences. At 23%, the proportion of total PYLL related to income differences was greater than that due to all injuries or circulatory diseases. |