 |
Let’s
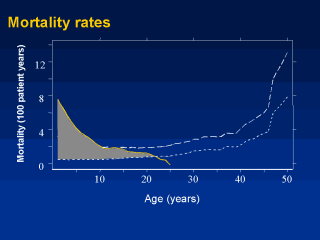
return to our mortality graph to visualize the excess cohort mortality that will be
simulated in the clinic population. The extra-deaths are defined by the area between the
clinic mortality rate (which is subject to late-entry underreporting) and the
gold-standard cohort mortality rate (shaded region).The excess cohort mortality rate in each
year of life is converted to the expected number of unrecorded deaths in the clinic-based
patient population in each year from birth to 25 years (total simulated deaths=684), and
each death is randomly assigned a date of birth within the year. These extra, simulated
deaths are appended to the clinic-based patient dataset, and time from birth to death is
presented by gender using standard Kaplan-Meier methodology. The precision of simulated
Kaplan-Meier statistics is examined using bootstrapping (1), a technique in wide use in
epidemiology (e.g. 2;3). One thousand bootstrap realisations of the ‘excess mortality
rate’ dataset allows the calculation of 95% bias corrected and accelerated (BCA)
confidence limits for Kaplan-Meier estimates and for associated Greenwood confidence
limits. Results are compared to the standard statistical adjustment.
References
(1) Efron B, Tibshirani RJ. An Introduction to the
Bootstrap. New York: Chapman and Hall, 1993.
(2) Hendriks JC, Satten GA, van Ameijden EJ, van Druten HA,
Coutinho RA, van Griensven GJ. The incubation period to AIDS in injecting drug users
estimated from prevalent cohort data, accounting for death prior to an AIDS diagnosis.
AIDS 1998; 12(12):1537-1544.
(3) Tsodikov A, Hasenclever D, Loeffler M. Regression with bounded
outcome score: evaluation of power by bootstrap and simulation in a chronic myelogenous
leukaemia clinical trial. Stat Med 1998; 17(17):1909-1922. |
