| front |1 |2 |3 |4 |5 |6 |7 |8 |9 |10 |11 |12 |13 |14 |15 |16 |17 |18 |19 |20 |21 |22 |23 |24 |25 |26 |27 |28 |review |
 |
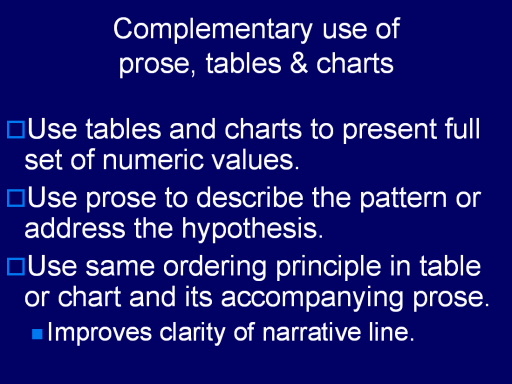
As noted above, tables and
charts are effective ways to organize a lot of detailed numbers
because the row and column headings or axis and legend labels convey
the identity of variables and their units or categories. Complement
them by using prose to ask and answer the research question, helping
readers understand how the numeric evidence in the table or chart
answers the research question under study.
See J.E. Miller, The
Chicago Guide to Writing about Numbers
(Chicago, 2004), Chapters 1 and 2 for more information about choosing the
right tools to suit your task presenting numbers;
Chapters 6 and 7 for
creating effective tables and charts.
|