 |
Often, a priori criteria
will suggest how to classify different items to be displayed in a
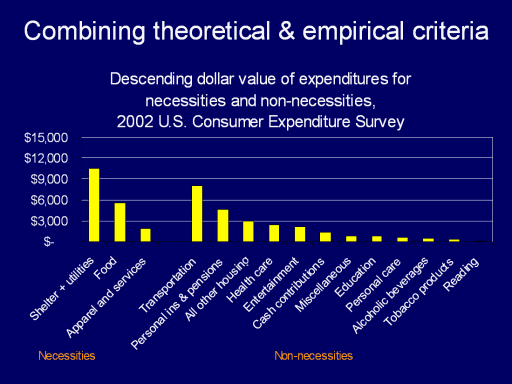
table or chart. This chart organizes categories of consumer
expenditures in necessities and non-necessities, using standard
definitions provided by the Bureau of Labor Statistics (see Duly, A.
(2003). Consumer spending for necessities. Monthly Labor Review.
126(5): 3.
http://stats.bls.gov/opub/mlr/2003/05/art1full.pdf). Sorting
categories in descending order of dollar value within each of the
major classifications of necessities and non-necessities promotes a
logical description of the pattern within each of those conceptual
groupings.
|
