| front |1 |2 |3 |4 |5 |6 |7 |8 |9 |10 |11 |12 |13 |14 |15 |16 |17 |18 |19 |20 |21 |22 |23 |24 |25 |26 |27 |28 |29 |30 |31 |32 |33 |34 |35 |36 |37 |38 |39 |40 |41 |review |
 |
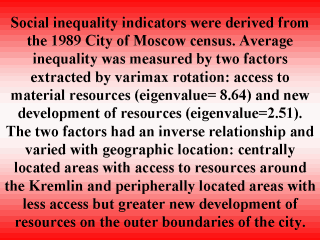
Mean factor
scores were calculated for each of the 33 areas. Relative inequality within urban areas
was constructed from three rate ratios as described in the previous section and linked to
the respondentís district of residence in Moscow. The multilevel model separated the fixed and random variations at the individual and urban area levels. A two level model is reported here: level 1 refers to the individual and level 2 refers to the urban area of Moscow in which the individual resides. |