| front |1 |2 |3 |4 |5 |6 |7 |8 |9 |10 |11 |12 |13 |14 |15 |review |
 |
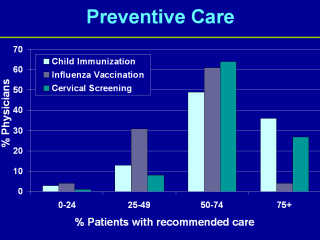
This graph and the following two graphs, summarize the results for each indicator as: the distribution of physicians according to the proportion of their patients that received the recommended care. For example, for nearly half (49%) of the physicians included in the childhood immunization, between 50 and 74% of their eligible patients completed their vaccination schedules. |