| front |1 |2 |3 |4 |5 |6 |7 |8 |9 |10 |11 |12 |13 |14 |15 |16 |17 |18 |19 |20 |21 |22 |23 |24 |25 |26 |27 |28 |29 |30 |31 |32 |33 |34 |35 |36 |37 |review |
 |
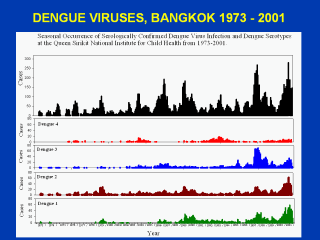
The most upper figure shows dengue confirmed
hospitalized cases by 2months in 1973 –2001. There has been general upward
trend and more cases some year than others. Each year, peak hospitalization
rates occur during the month of July thru October. The lower 4 graphs show
isolations by dengue serotype for serotype 1, 2, 3 and 4 by 2 months. You
will see clearer in the next slide. |