| front |1 |2 |3 |4 |5 |6 |7 |8 |9 |10 |11 |12 |13 |14 |15 |16 |17 |18 |19 |20 |21 |22 |23 |24 |25 |26 |27 |28 |review |
 |
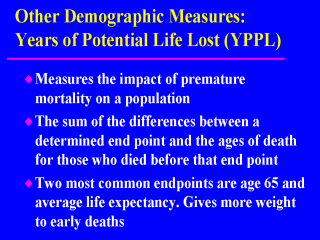
Years of Potential Life Lost Rate -
represents years of potential life lost per 1000 population below the age of 65 years (or
below average life expectancy). Should be used to compare premature mortality in different populations since YPLL does not account for differences in population sizes. |